ZHENG Wen-wei, WANG Li-na, XIE Jing-xin, ZHOU Ji-xuan, ZHANG Kuan, YAN Jin-xian
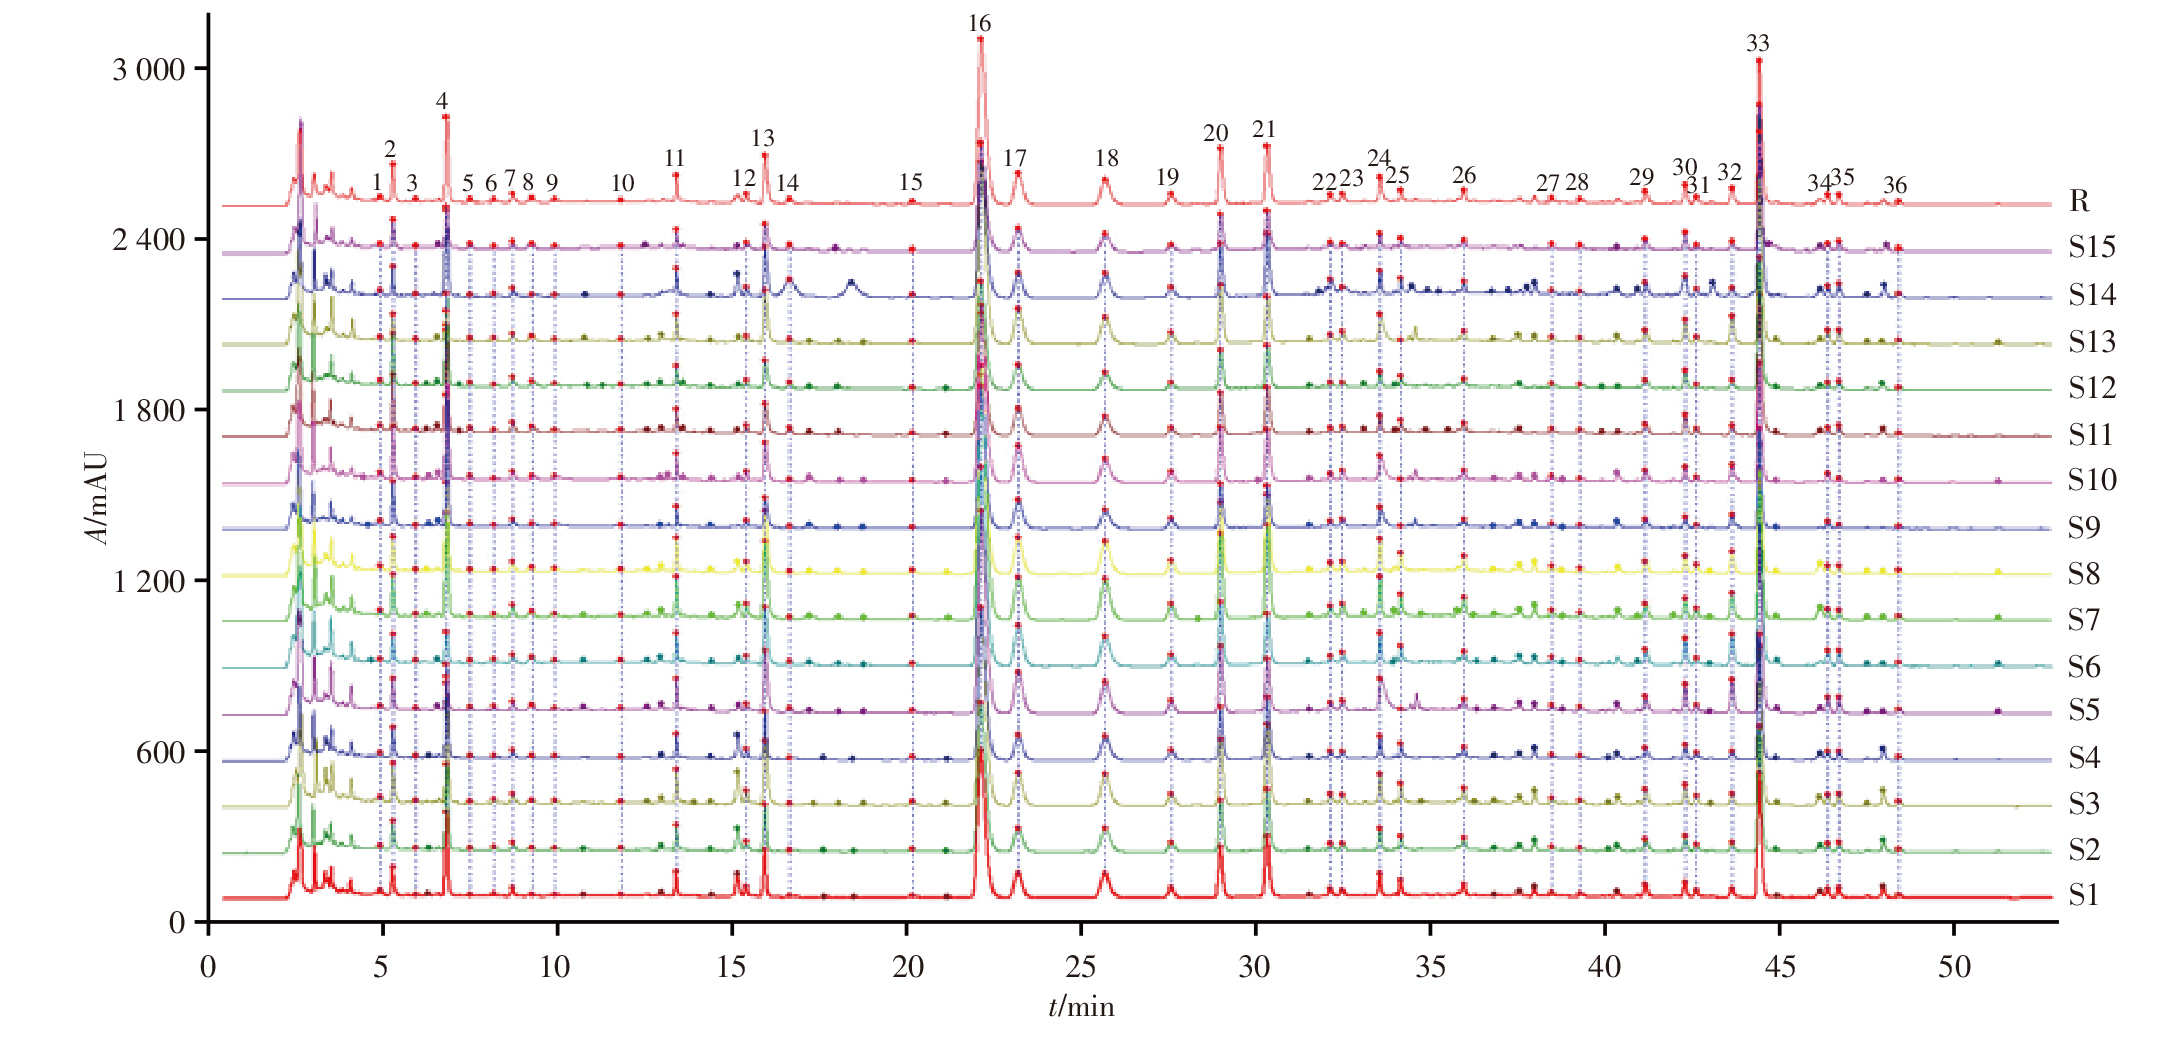
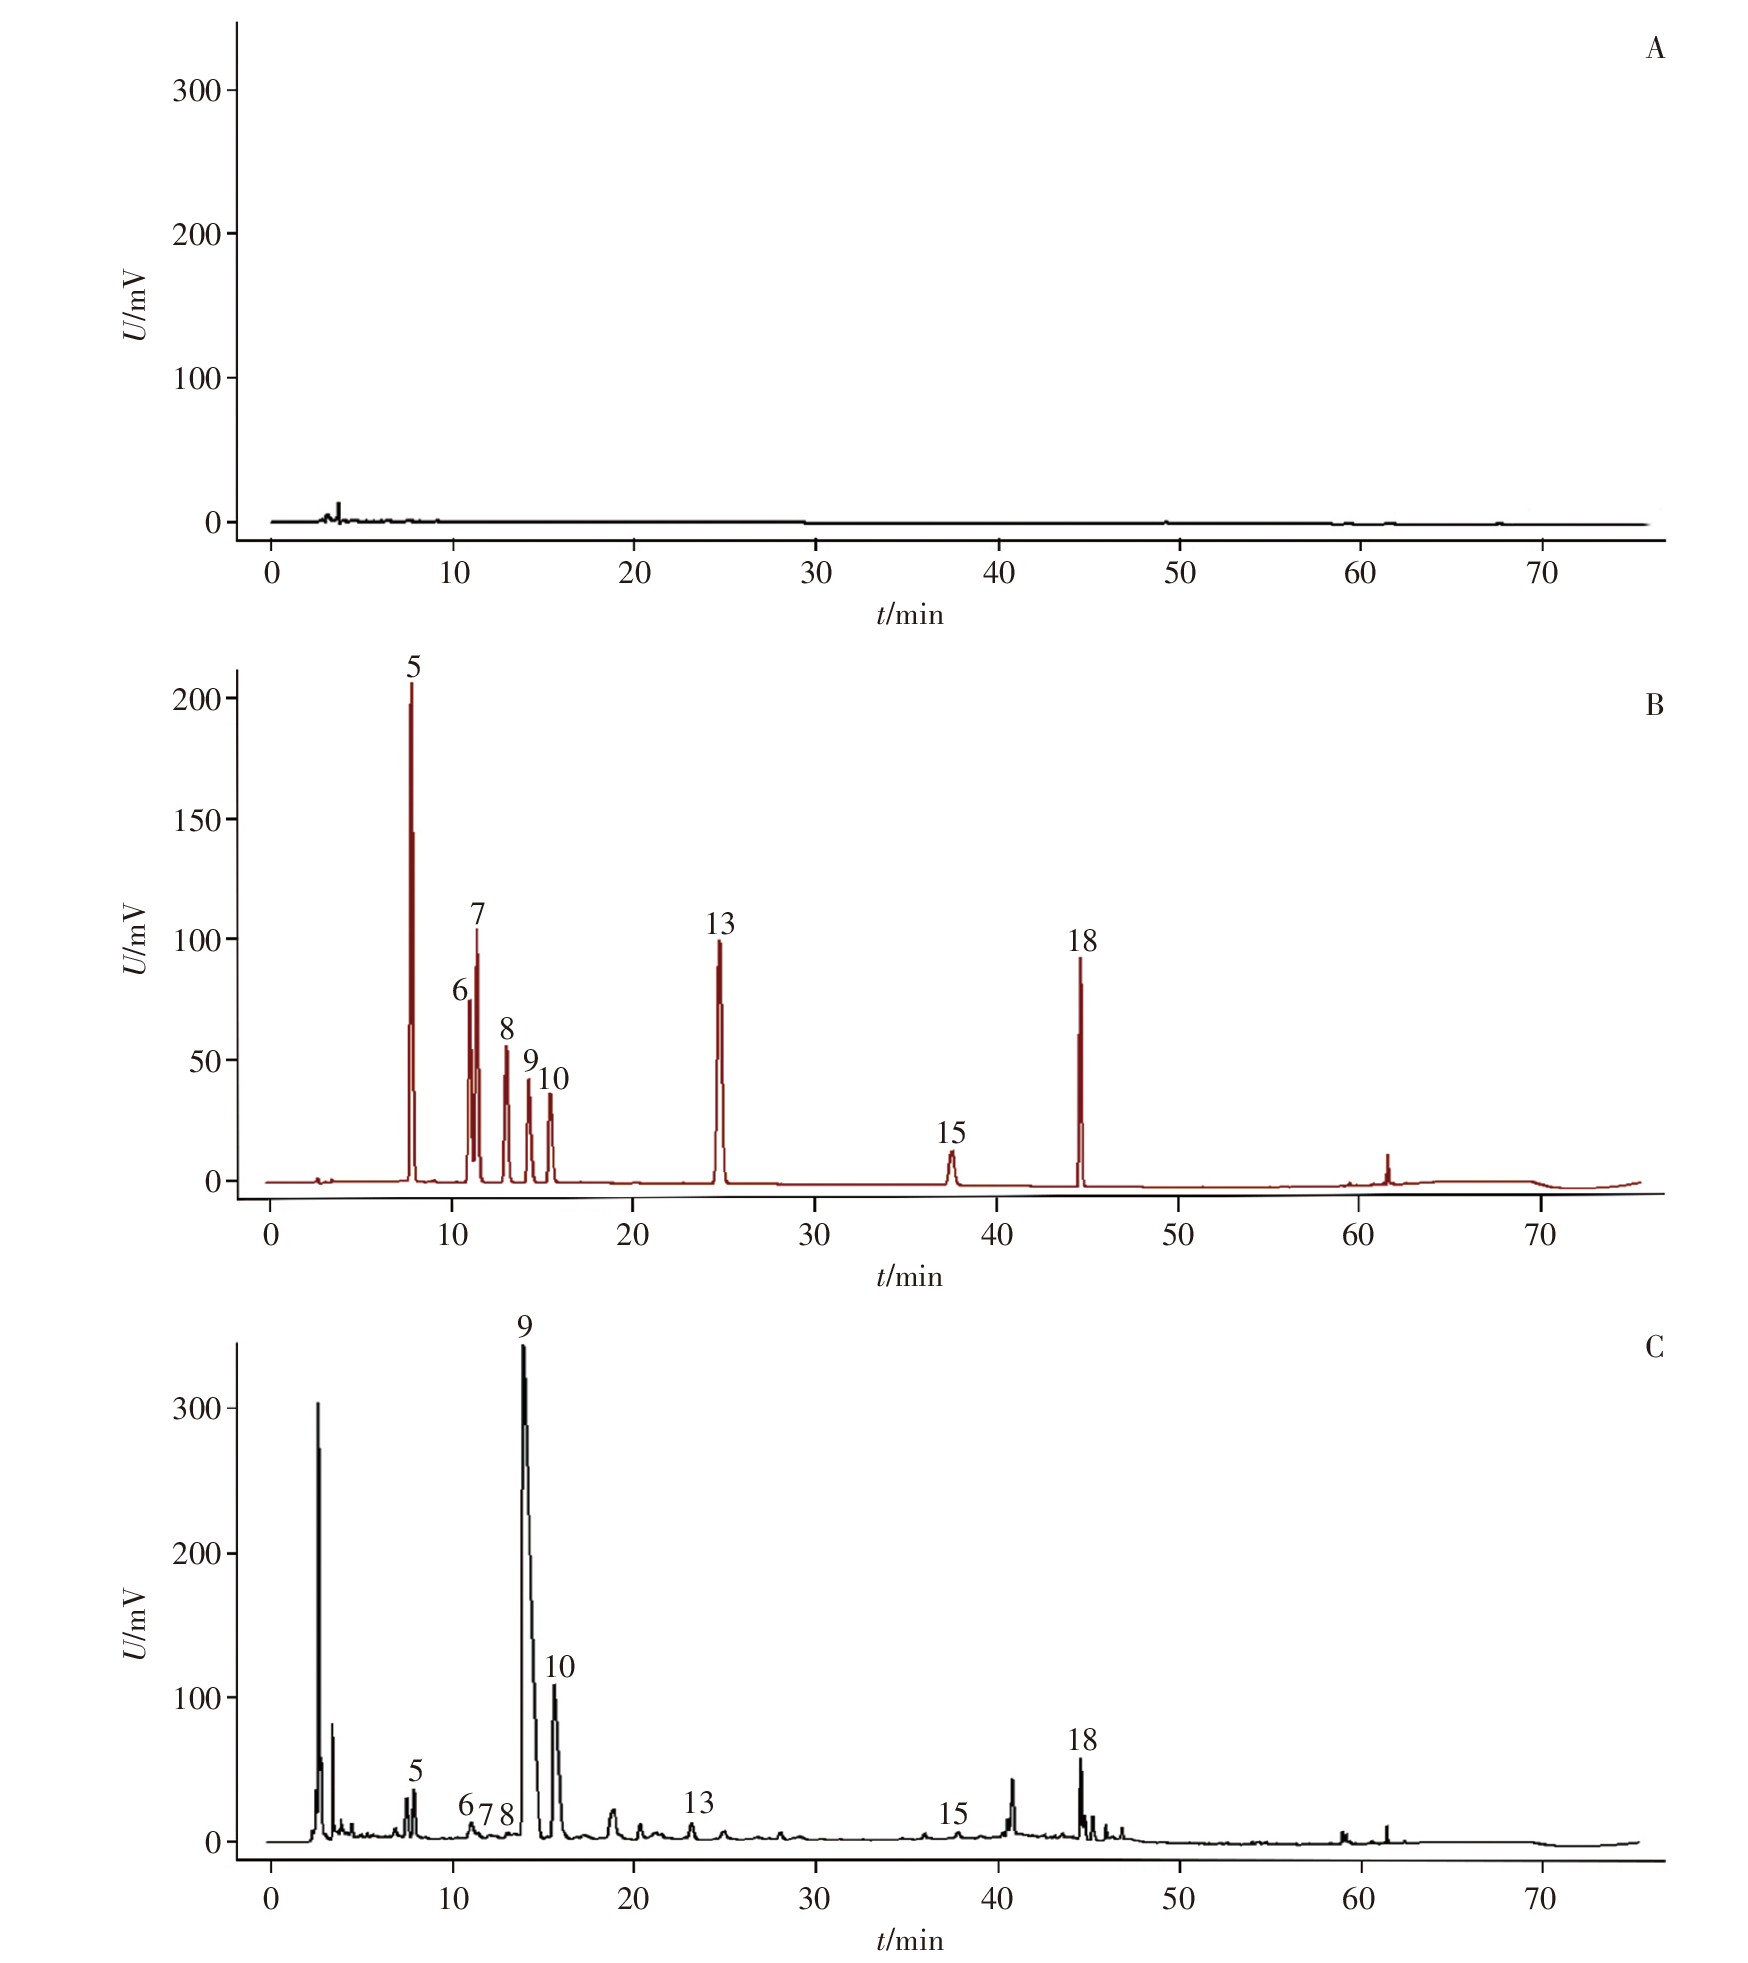
Objective: To establish a quality evaluation method for compound Shihu Xiaoke granules by combining HPLC fingerprinting, quantitative analysis of 21 components, chemometrics, and entropy-weighted TOPSIS, thereby providing a basis for improving its quality standards. Methods: A Thermo Scientific AccucoreTM XL C18 column (250 mm×4.6 mm, 4 μm) was used at 30 ℃ for gradient elution with a mobile phase of acetonitrile-0.2% phosphoric acid aqueous solution at a flow rate of 1.0 mL · min-1, a detection wavelength of 265 nm, and an injection volume of 10 μL. The HPLC fingerprints of compound Shihu Xiaoke granules were established, and a quantitative analysis method for 21 components was developed and validated. With the obtained data, hierarchical cluster analysis (HCA), principal component analysis (PCA), orthogonal partial least squares-discrimination analysis (OPLS-DA), and entropy-weighted TOPSIS were then employed to evaluate the quality of 15 batches of samples. Results: Methodological validation confirmed that the established fingerprints and quantitative analysis methods met analytical requirements. The similarity of fingerprints for 15 batches of compound Shihu Xiaoke granules ranged from 0.982 to 0.999, with 36 common peaks, of which 21 were identified. HCA, PCA, and OPLS-DA yielded consistent results, clustering the 15 batches into three main categories. With the threshold of variable importance for the projection (VIP)>1, 22 potential differential markers were screened out. The average content of the 21 quantified components—gallic acid, danshensu, protocatechuic acid, protocatechualdehyde, 3'-hydroxypuerarin, caffeic acid, puerarin, mangiferin, 3'-methoxypuerarin, puerarin-6"-O-glucoside, puerarin apioside, daidzin, glycitin, calycosin glucoside, genistin, rosmarinic acid, lithospermic acid, daidzein, salvianolic acid B, calycosin, and salvianolic acid A—ranged from 0.012 mg · g-1 to 2.129 mg · g-1. The entropy-weighted TOPSIS evaluation indicated that batch S5 had the best quality. Conclusion: The established fingerprint and quantitative analysis method for 21 components are accurate, reliable, and reproducible. The approach combining HPLC fingerprinting, quantitative analysis of 21 components, chemometrics, and entropy-weighted TOPSIS enables comprehensive and objective quality evaluation of compound Shihu Xiaoke granules, providing a new technical means for quality control of this preparation.